Flowcharts
Steps, decisions and outcomes laid out in a clear flow.
Turn processes, teams and timelines into diagrams made for your next presentation. Describe it in plain words and get a precise, editable diagram.
Pick a diagram type and describe it in plain words. DiagramsPro lays out the shapes and connectors for you.
A new customer signs up. We send a welcome email and check their plan. If they're on a team plan, book an onboarding call. Otherwise, share the setup guide. Either way, they complete setup.
Our customer success team reports to the head of customer success. Under them are three leads: onboarding, support and account management.
Product launch: plan in January, build in February and March, open beta in April, launch in May.
Example diagrams, for illustration.
Steps, decisions and outcomes laid out in a clear flow.
Teams and reporting lines from a simple list.
Who does what, in what order, with every handoff between teams.
Milestones and phases in date order, readable at a glance.
Each example follows the same grammar: rounded steps for actions, a diamond for each question, a label on every branch and plain lines for reporting relationships.
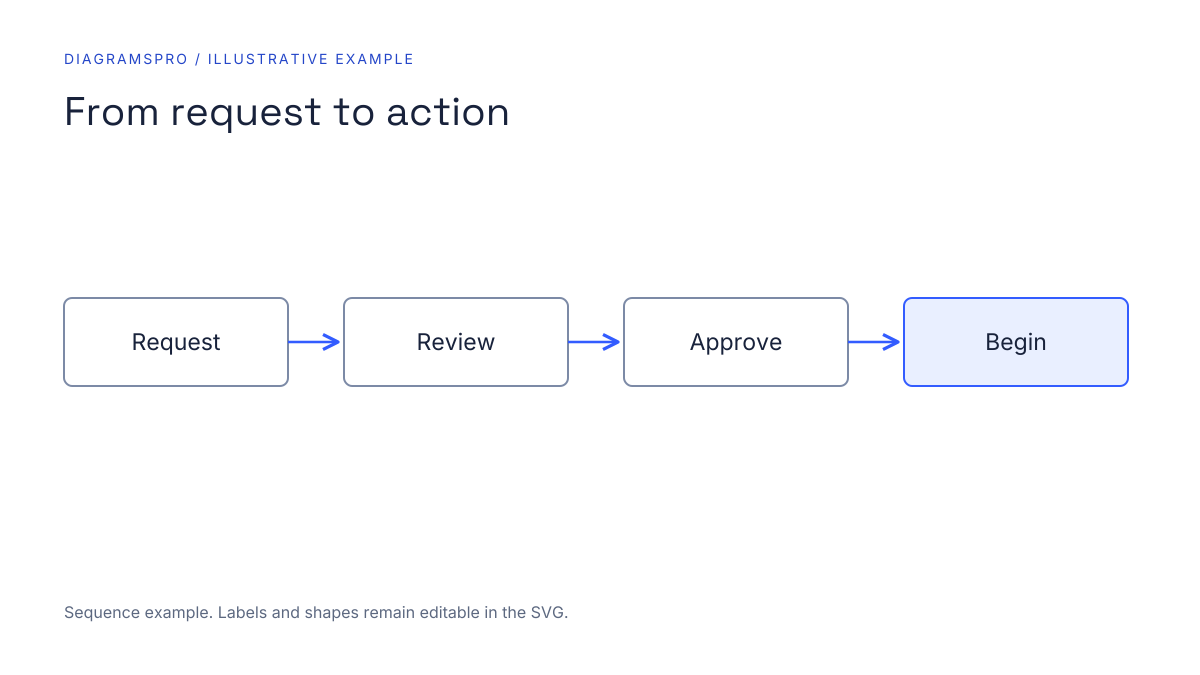
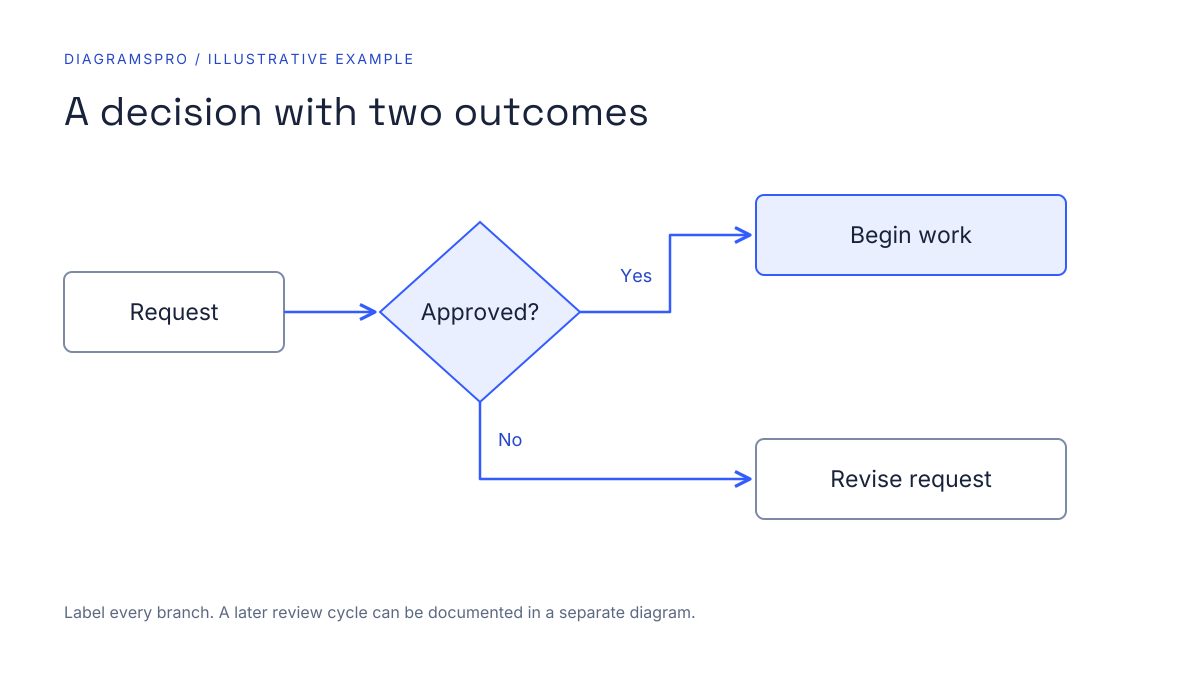
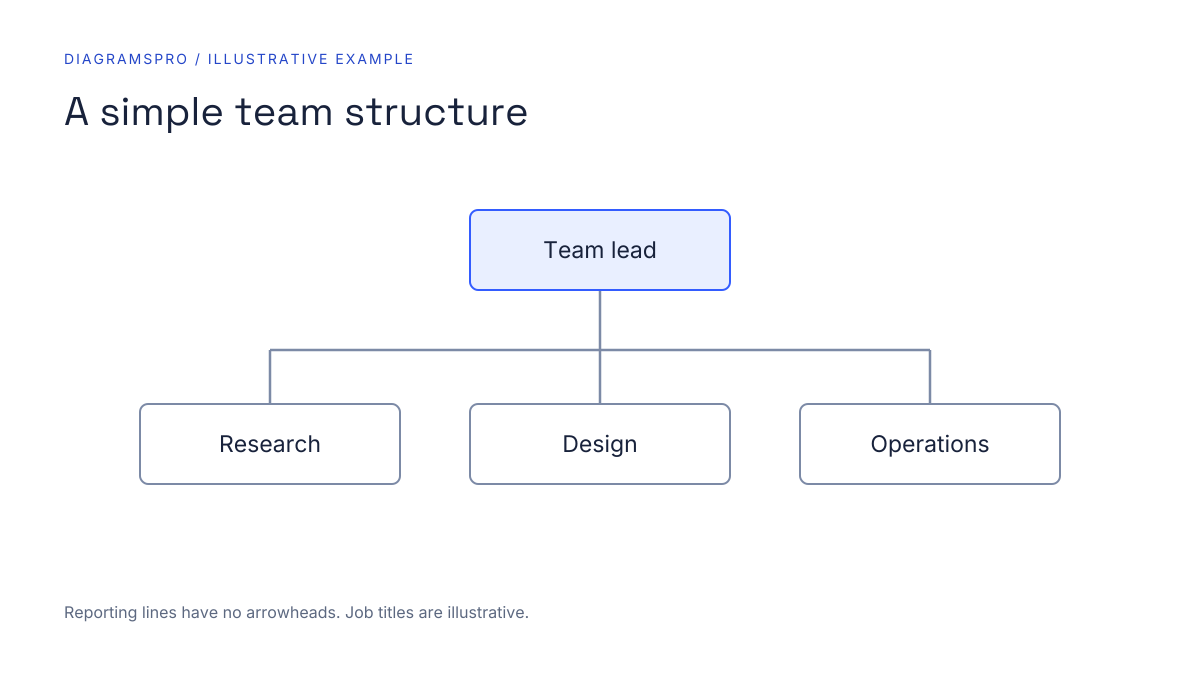
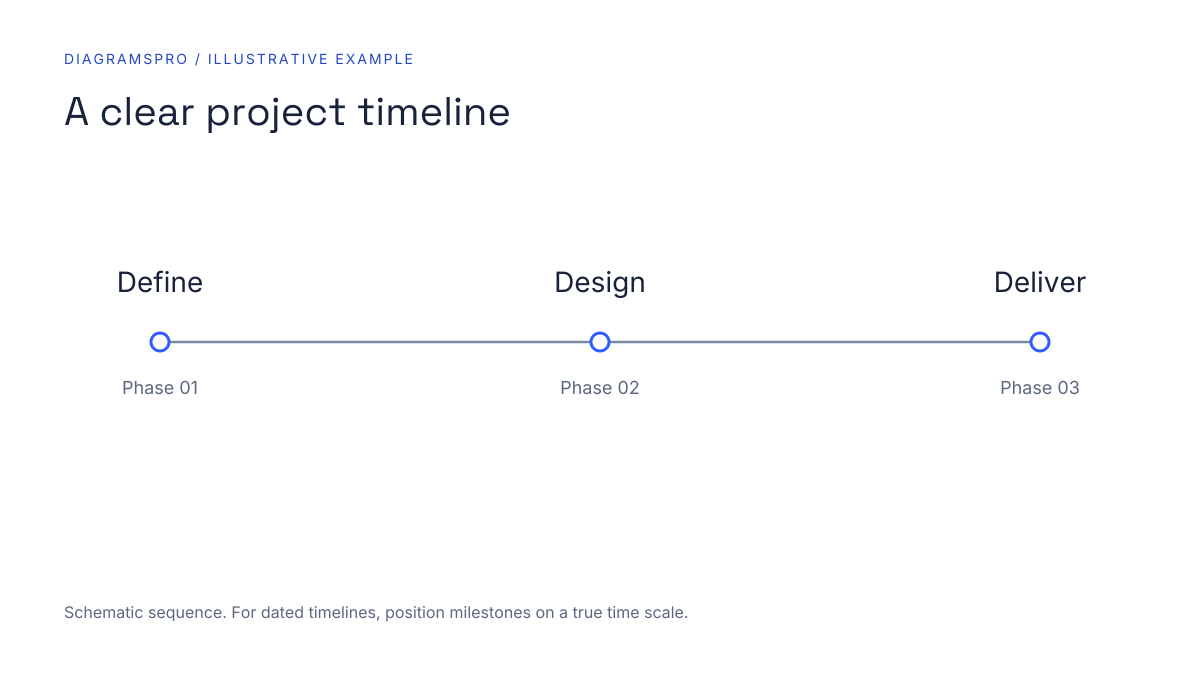
Illustrative examples from the DiagramsPro brand kit, shown at 16:9 slide proportions.
Each type answers a different question. Here is what goes into each one, so your description covers it.
Processes with yes/no choices and more than one possible outcome
Work that passes between teams, roles or systems
New teams, reorganisations and onboarding packs
Project plans, launches and roadmaps shared with stakeholders
Four steps. No dragging boxes, no aligning connectors.
Write it the way you'd explain it to a colleague: who does what, in what order, and where it splits.
Choose the shape that answers your question: sequence and decisions, reporting lines, handoffs or dates.
DiagramsPro lays out the shapes and connectors. Check that every branch reaches an end.
Rename labels, move shapes, restyle, then drop the diagram into your deck, doc or wiki.
Start with a process you already explain out loud. Here are some that work well as diagrams.
Every step from sign-up to first value, so each new customer gets the same good start.
Renewal reminders, the review call and the path to renew or upgrade, owner by owner.
Application to offer, with each interview round and decision point.
From code review to launch: who approves, what gets tested and how the team hears about it.
Discount levels, sign-offs and the path from quote to signed contract.
Reporting lines for a new team or after a reorganisation.
Phases, milestones and dependencies laid out on one readable line.
Who does each step when work moves between sales, finance and delivery.
Anyone who has drawn the same process on a whiteboard more than once can write it down instead.
Turn a written SOP into a flowchart new starters can follow without asking who handles the next step.
Paste the new reporting lines as a list and get a chart ready for the all-hands announcement.
Show how a change moves from review to production, who signs off and how the team is told, in one diagram.
Describe how a client's process works today and how it should work, then put both maps side by side.
Phases and milestones on one line, so the next review starts from the same picture.
Break a procedure into clear boxes and arrows for a lesson, handout or training deck.
Most diagrams start in one of these ways. Here is how they differ.
| Compared on | Drawing by hand in a diagram tool | Sketching on a whiteboard | DiagramsPro |
|---|---|---|---|
| Where you start | An empty canvas and a shape library | A marker and whoever is in the room | A plain-language description of the process |
| Laying out shapes | You place and align every box yourself | Quick, but spacing is whatever fits | Shapes and connectors are laid out for you |
| Changing a step | Move boxes and redraw connectors by hand | Wipe and redraw that part of the board | Edit labels and move shapes in the diagram |
| Choosing the diagram | Full control over any notation you know | Freeform, good for early thinking | Pick flowchart, org chart, process map or timeline |
| Skill needed | Comfort with the tool and its symbols | None, which makes it great for workshops | Being able to describe the process in words |
| Where it ends up | Exported and placed into documents | A photo that is hard to edit later | Ready to drop into a deck, doc or wiki |
This compares ways of working, not specific products. Whiteboards remain a good place to think before you write it down.
When the diagram is ready and the rest of the presentation still needs building, an AI presentation maker like Presentations.AI can draft the slides around it.
A step-by-step method for turning any process into a clear flowchart: scope it, list the steps, add decisions, lay it out and check it.
26 Oct 2026Article · 5 min readHow to write a plain-words process description that a text-to-diagram tool can turn into a clear flowchart, org chart or timeline on the first attempt.
27 Oct 2026Article · 5 min readHow to fit a flowchart, org chart or process diagram onto a slide or into a report so readers get the point in seconds, not after squinting.
27 Oct 2026Article · 5 min readHow to draw an escalation and on-call path for an engineering runbook: severity levels, who is contacted when, time limits, and the handoffs that fail.
27 Oct 2026An AI diagram maker. It turns a written description of a process or team into a flowchart, org chart, process map or timeline.
Yes. Change labels, move shapes and restyle the diagram as you like.
No. If you can describe the process in words, you can make the diagram.
A swimlane diagram. It gives each team its own lane, so handoffs between teams are easy to see.
Include every step, who does it, and each decision as a yes/no question. Short phrases are enough.
Diagrams stay readable up to roughly fifteen boxes. For bigger processes, split them into an overview and detailed sub-processes.
In presentations, documents, wikis and anywhere else you need to explain how something works.
A flowchart shows the steps and decisions in one process. A process map adds who does each step, and is often drawn at a higher level to show how a whole piece of work moves through a team.
Describe it in plain words, check that every branch reaches an end, then drop the diagram into your next deck.